Sunday, October 15, 2017

NIFTY JOURNEY ALONG VARIOUS TIME FRAMES

NIFTY SHORT-TERM INDICATORS SHOW HIGH BULLISHNESS BUT THE MEDIUM

TERM IS BLEAK WHEREAS LONG TERM IS ANY WAY SHOWS THE CURRENT UP- 

TREND CONTINUATION AS NO MAJOR CHANGES DEVELOPED FOR A REVERSAL....


6-MONTHS


ONE YEAR


TWO YEARS BOX MODEL


TWO- YEAR - FOCAL FAN MODEL  USEFUL FOR LONG TERM


THANKS TO CHART INK


Monday, October 2, 2017

Bharti Airtel: Hang up

BAVADHARINI K S


Regulatory changes and intense competition are weighing on the company
Bharti Airtel, a large telecom player with 23 per cent customer share, has been in a spot since last September. The entry of Reliance Jio has led to price pressure and industry consolidation. Additionally, regulatory changes have put pressure on revenue and earnings.
However, the company has been adapting reasonably well. It has the highest spectrum holdings (about 1,160 MHz.).
This helps the company to launch any advanced services swiftly — it is working to implement services such as VoLTE and 5G, pan-India.
It has also been strengthening its network through merger and acquisition deals — with companies such as Tikona Digital Networks and Telenor India to strengthen its presence in 4G services. It is also partnering with SK Telecom to improve network experience.
The stock has been on an uptrend, gaining 21 per cent over the last 12 months, boosted by new partnerships forged. At ₹388, it currently trades at 41 times its trailing 12-month earnings, compared with 32 times in the past three years.
This is pricey and there are looming near-term uncertainties. For one, the impact from Jio’s new feature phone launch remains to be seen.
Two, profit declined 75 per cent to ₹367 crore in the June quarter. This follows 72 and 54 per cent fall in the March and December quarters, respectively.
Also, there may be short-term pressure due to reduction of IUC and higher GST rate that may dent company earnings. Its interest cover has also slipped in the last few quarters.
Investors can, therefore, sell the stock and look for re-entry after there is more clarity.
Over the long term, the company’s leadership position, strategy to invest aggressively to increase market penetration, divestment strategy, expected growth in data demand and likely growth in average revenue per user bode well for the company.
Mobile pressure

Airtel provides 2G, 3G and 4G services in all 22 circles. While usage parameters are growing, mobile segment, which accounts for 77 per cent of revenue, has been under pressure.
The overall mobile data traffic in the industry increased nearly 70 per cent between June 2016 and June 2017. Airtel’s data customer base rose 6.2 per cent Y-o-Y in June 2017; the overall customer base increased 9.7 per cent Y-o-Y to about 26 crore; minutes on the network increased 34 per cent; data usage per customer jumped to 2,611 MB in June 2017 from 904 MB in June 2016.
Data usage per customer increased significantly — 189 per cent Y-o-Y. The data consumption has been on an uptrend for five years and is set to increase further. However, voice and data average revenue per user (ARPU) declined 20 per cent Y-o-Y and 23 per cent Y-o-Y, respectively, during the June quarter. For the same period, India’s mobile segment revenue witnessed a decline of 14 per cent Y-o-Y to ₹12,915 crore from ₹15,042 crore in the previous year.
Tepid growth

The company’s other revenue streams are picking up, but slowly. Business and tower infrastructure services contribute 11 per cent and 6 per cent of revenue, respectively, and these increased 10 and 4 per cent Y-o-Y, respectively. The tower segment will benefit from the constant demand to upgrade technology. However, the company has been selling its stake in this segment to improve cash flow.
Bharti Airtel also earns revenue from digital TV and home services. Digital TV service revenue increased 7 per cent Y-o-Y to ₹897 crore in the June quarter. The revenue growth of home services was 1 per cent. Increasing demand for data will aid growth in these segments, but how well it can compensate for the fall in mobile segment revenue remains to be seen.
Financials

The revenue downtrend seems to be accelerating. From 12 and 3 per cent Y-o-Y declines, respectively, in the March and December quarters, revenue declined 14 per cent Y-o-Y to about ₹21,958 crore in the June quarter. Sequentially, revenue improved 0.12 per cent, indicating a likely flattening of Jio impact.
For FY17, revenue declined 1 per cent to ₹95,468 crore. Profit decreased 38 per cent to ₹4,241compared to the same period previous year.


The recent regulation for reduction in the interconnection usage charge (IUC) can speed up the adoption of technology such as VoLTE but there are short-term concerns as profits may be dented. Debt-equity ratio has remained flat at about one time since FY15. Interest cover has however, slipped to 1.8 times, from 2.5 times in FY16.
http://premium.thehindubusinessline.com/portfolio/firm-calls/bharti-airtel-sell/article9883433.ece
August data points to early signs of revival in economic growth

Sectoral indicators suggest demonetisation, GST aftershocks are wearing off but the uptick in inflation and weak credit growth in August had a sobering impact on sentiment


 One of the bright spots in the Indian economy is a 10.29% jump in exports in August to $23.8 billion from $21.5 billion in the same month a year earlier. Photo: Pradeep Gaur/Mint

One of the bright spots in the Indian economy is a 10.29% jump in exports in August to $23.8 billion from $21.5 billion in the same month a year earlier. Photo: Pradeep Gaur/Mint

New Delhi: Several sectoral indicators for the month of August point to early signs of a revival in economic growth, which slowed to 5.7% in the June quarter, according to analysts.
The improvements suggest that the aftershocks of demonetisation and the rollout of the goods and services tax (GST) are wearing off.
Sales of two-wheelers, commercial vehicles and tractors, power generation, steel production, airport traffic and fund-raising from equity markets by businesses reported faster annual growth in August than in the previous month, brokerage Jefferies Group LLC said in a 25 September note to investors.
The uptick in inflation and weak credit growth in August, however, had a sobering impact on sentiment.
“Steady and robust” growth was visible for a while in sales of passenger vehicles and tractors, while early signs of growth recovery are visible in August in two-wheeler sales and in rail freight, UBS Securities India Pvt. Ltd, another brokerage, said in a note to clients on the same day.
One of the bright spots in the economy is a 10.29% jump in exports in August to $23.8 billion from $21.5 billion in the same month a year earlier.
The UBS report, however, cautioned that while manufacturing activity as reported by the Nikkei India Manufacturing Purchasing Managers’ Index (PMI) resumed expansion in August, services output remained subdued.
Manufacturing PMI rose to 51.2 in August, indicating an expansion from 47.9 in July. A reading above 50 indicates expansion, and below that a contraction.
Nikkei India Services PMI at 47.5 in August suggested services output declined for the second consecutive month, although the decline was less severe than in July, when the index was at 45.9, IHS Markit Ltd said on 5 September.
The Modi government, which was caught on the wrong foot on account of the unexpected deceleration of the economy in the fiscal first quarter from 6.1% in the preceding three months, is currently exploring policy measures and administrative reforms that could spur investments.
Policymakers hope that the “frontloading” of public spending in the early months of the current fiscal year is helping funds to be utilized efficiently and will lead to a pick-up in growth in the coming months.
However, any decision to deviate from its fiscal consolidation plan will only be taken as part of the budget exercise and with the sanction of Parliament, two finance ministry officials said on condition of anonymity.
Economists said that the effects of demonetisation and GST may be diminishing, but the overall weakness in the economy is still a cause for concern.
“I would not necessarily call it a revival. The exceptional slowdown in the GDP growth rate (in the June quarter) on account of supply disruptions arising from GST rollout is reversing. Also, coal offtake which suffered during monsoon has picked up in August. We are back on track, but below the anticipated levels,” said HDFC Bank Ltd chief economist Abheek Barua.
“The key positive in August was the further acceleration in commercial vehicle sales and uptick in exports and imports. The key negative was the uptick in inflation, and weak credit growth. Freight data remained mixed with ports remaining weak and railway freight improving,” said the note from Jefferies Group.

Sunday, October 1, 2017

The Fibonacci mystique in markets

LOKESHWARRI S K

shutterstock.com

The number sequence of Leonardo Fibonacci has an uncanny ability to influence financial markets. Lokeshwarri S K offers a peek into this wonderland
To a casual observer, the stock market would appear to be a blur of activity with stock prices reacting randomly to news flow and to the sudden bursts of emotion that seem to grip traders every now and then.
It is probably for this reason that the ‘random walk hypothesis’, first proposed by the French broker Jules Regnault in 1863 and later popularised by Burton Malkeil and Eugene Fama, found a loyal band of followers. This theory states that there are no discernible patterns in the stock market and hence the future moves cannot be predicted.
There are, however, a large group of economists, investors and analysts who believe that the study of past prices shows definite patterns that can be used to predict future trends. One of these price forecasting methods, widely used in equity, commodity, forex and other markets across the globe, uses the Fibonacci sequence, popularised by the Italian mathematician Leonardo Fibonacci.
The regularity with which the numbers and ratios in this sequence recur in price patterns in financial markets is astounding, making them a reliable guide in price projections. Here’s a glimpse of the influence wielded by these numbers.
The Fibonacci sequence

Born between 1,170 and 1,180, Leonardo Fibonacci, son of a merchant, probably lived in one of the towers of Pisa that served as workshops, fortresses and family residences. When his father was appointed a customs official, he accompanied him on his tours in the Mediterranean region, meeting merchants from various countries. After one of his travels, he wrote the book Liber Abaci in which he introduced the Fibonacci sequence to Italians through the rabbit problem.
It is believed that the number sequence that was published by Fibonacci was not new. A similar sequence had been written about in some Indian scriptures published decades earlier. But Fibonacci was the first to popularise the numbers in the Western world.
The rabbit problem mentioned in Liber Abaci goes thus — How many pairs of rabbits placed in an enclosed area can be produced in a single year from one pair of rabbits if each pair gives birth to a new pair starting with the second month?
The answer to the problem is 144, arrived through the sequence that shows the number of pairs at the end of each month,
1,1,2,3,5,8,13,21,34,55,89,144
Each successive number in this series is the sum of two preceding numbers. If we divide one number in the series by the number to the right of it, after the first four numbers or so, we get the ratio 0.618. If a number is divided by the number to its left, we get 1.618. The numbers 0.618 and 1.618 also form the golden ratio or the golden mean that is said to be pleasing to the eye and recurs frequently in music, art, architecture and nature. There are numerous other ratios and relationships that can be derived from this sequence, some of which will be discussed later.
There are many instances of the Fibonacci sequence and the golden ratio in natural phenomena, including the seed curves on the sunflower, arrangement in pine cones, petals in flowers, branches in a tree, sub-division of the human body and so on.
So how are these numbers connected to stock and other markets? Since stock markets are a manifestation of the actions of a group of men, it is basically the behaviour of humans that determines stock market movement.
Frost and Prechter, in their epic book, The Elliott Wave Principle, write, “This truth suggests that men’s emotions, in their mass expression are keyed to the laws of nature.” It is therefore not surprising that the Fibonacci numbers wield influence on stock markets too.
Fibonacci retracement

Getting down to the practical application of the Fibonacci numbers, if the stock market is correcting and you are wondering where the price decline can halt, you can use Fibonacci retracement levels. Similarly, if the price is beginning to move higher after a decline, these retracement levels can indicate the extent of the up-move.
We looked at two ratios, 0.618 and 1.618, which can be derived by dividing a number by the numbers adjacent to it. If a number in the sequence is divided by a number one place away to its right, we get the ratio 0.382, on dividing by a number two places away, we get the ratio 0.236.
The Fibonacci retracement levels are based on these ratios — 0.236, 0.382, 0.618. 0.55 is added in between, perhaps because 55 is a Fibonacci number and the half-way mark is always a significant support or resistance. I have found the 0.382 and the 0.618 ratios most effective. A downward correction that halts at 0.382 implies that the uptrend has strength while a fall that goes below 0.618 implies that the bears have taken over.
To calculate the retracement, the previous move is measured and multiplied by the ratios. The values are deducted from the recent peak to derive levels where price decline can halt or added to lows to derive levels where rallies can end. These retracement levels are equally effective along all time frames: intra-day, daily, weekly, monthly or quarterly.
Take, for instance, the US dollar index chart. It has been in a structural decline since 2001, as the global economy went into an expansionary phase, beginning a long-term rally in most stock markets. The dollar index fell from the 2001 peak of 121 to bottom at 71 in 2008. A rally has been in progress since 2008, but it has halted at 0.618 retracement of the previous down-move that occurs at 102. The struggle of this index to surpass the zone around 100 is partially due to the retracement hurdle in the vicinity.
Since these levels are very popular and many investors and traders are watching them, they tend to be self-fulfilling.
The 0.618 per cent retracement has also come to the aid of the Sensex many times in severe declines. The fall in 2008 in the Sensex halted slightly below the 0.618 retracement of the up-move from April 2003 to January 2008. But the decline in 2015 halted around the 0.618 retracement of its previous move.
The retracements can be applied to stocks too. The stock of Axis Bank has been holding above the 0.618 per cent retracement on its long-term chart, which is at ₹345 over the last two years, showing that the stock still holds promise.
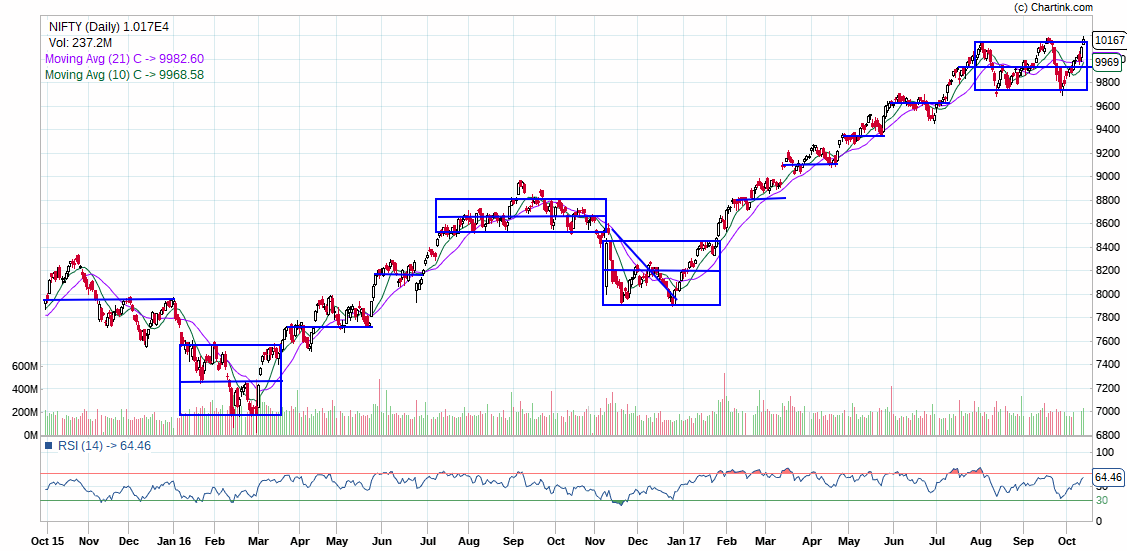
Projection: If we attempt to apply the retracement tools to the weekly chart of Nifty, it will tell the extent to which the current decline can extend. The up-move preceding the current correction began at the December 2016 low and ended on August 4 this year. If we retrace this move, we get the likely targets of this fall at 9634 (0.236), 9,307 (0.382), 9,039 (0.5) and 8,771 (0.618). Since we are in a strong uptrend, the support at 0.382 level of 9,307 is critical.
Fibonacci extensions

When the price reverses direction, Fibonacci retracements are useful to project the extent of the next move but when price trends in the same direction, Fibonacci extensions are useful. Here the ratios derived by dividing a number in the Fibonacci sequence by a number to its left are also used. The ratios used for extensions are 0.618, 1.000, 1.618, 2.618 and 4.235.
Since recent history is etched in the mind more clearly, the magnitude of moves is related to their preceding moves. For instance, in an up-move, if there is a brief pull-back, the extension ratios can be multiplied by the magnitude of the previous up-move and added to the end of the corrective wave to project the next move higher. Similarly, if the trend is down, the extension should be deducted from the end of the short-term pull-backs.
For instance, if we consider the weekly chart of DAX, the German benchmark index, one leg of an up-move was completed between January and August 2016. If we tried to project the next leg of the up-move using Fibonacci extensions, the targets were 11383 (0.618), 11990 (1.000) and 12,971 (1.618). The DAX made the peak at 12,921 in June this year and has reversed.
Projection: If we apply the extension rules to the Nifty weekly chart, the previous up-move lasted between March and September 2016 and resulted in a gain of 2,144 points. If we use this as an extension from the December 2016 low, we get the targets of 9217 (0.618), 10,037 (1.000) and 11,361 (1.618). The Nifty has achieved the second target and is currently pausing. If the up-move continues, the third target will be in the reckoning.
Relation with Elliott Wave Theory

The examples cited above use Fibonacci numbers and ratios in the most basic manner. The best way to use these ratios is in conjunction with Elliott Wave Analysis. R N Elliott believed that the stock market, like everything else in nature, has a form and no matter how minute or how large the form, the basic design remains the same. He laid down that market moves in up-moves made of 5 waves and down-moves made of 3 waves. The structure is the same, be it in a one-minute chart or a multi-year chart. The waves of Elliott are related to each other with Fibonacci ratios and the two work wonders when used in conjunction.
Using fans and arcs
There are some lesser known and less widely used tools such as the Fibonacci fans and arcs that can also be used effectively by traders and analysts. These tools bring in time as well as price projections. Most technical analysis software provide tools to draw these lines.
The Fibonacci fan is a three-line tool that uses the ratios .382, .50 and .618. To draw the Fibonacci fan, a trend line is drawn from the nearest peak to trough or vice versa. The vertical distance between a peak and trough is multiplied by the ratios .382, .50 and .618 and deducted from the peak or added to the trough where the trend-line ends.
Then three lines are drawn from the leftmost point in the trend line to intercept the vertical line at the three levels derived by the ratios. What we get is a Fibonacci fan with three lines.
Following a down-trend, these fans move down from the peak, thus providing resistance levels for the following up-move.
After an uptrend, the fans would fan upward, providing support levels for the next down-move.
Another visually pleasing way of utilising the ratios to derive supports and resistances is by drawing the Fibonacci arcs. The initial steps for drawing the arc are similar to that for drawing the Fibonacci fan. The ratios are multiplied with the vertical distance between a peak and a trough. Then arcs are drawn through these levels.
The major drawback with these tools is that they tend to lose their relevance in a prolonged sideways move. Secondly, since they are less used, they do not enjoy the psychological advantage that the Fibonacci retracement has.
Timing market reversals
Wouldn’t it be wonderful to know in advance if a market reversal is around the corner? Fibonacci time series is one of the tools available to project the time market moves can take. This tool hasn’t gained in popularity since it can be used mainly on the long-term horizon and traders in futures market do not really care about what happens beyond one day.
Fibonacci time-lines are fairly easy to draw on any technical analysis software. The first step is to identify a major trough or a peak. This will be the point where the first line will be drawn. Subsequent lines are drawn at intervals corresponding to the numbers in the Fibonacci series, 1, 2, 3, 5, 8, 13 and so on. The sessions that fall on any of these lines are likely to be reversal points for a move.
It would be best to draw the lines on weekly chart of benchmark indices. If we draw the Fibonacci time line from March 6, 2009, on the weekly chart of Sensex, the findings are quite astonishing. The 34-week line is at November 2010, where the first peak was formed. The 55-week line is at the significant bottom of November 2011 and the 89-week line is very close to the August 2013-low where the current bull market began. Since the number of weeks increases down the series, the next line according to this series is in Q1 of 2019.
If we draw a Fibonacci time series from the March 2016 low, the next line occurs seven weeks from now, or in November. That sets the stage for the possibility of a sharper fall towards the end of this year.
Others have also tried to plot long-term cycles in stock markets. Samuel T Benner, a wheat farmer, framed multi-year cycles for markets using cycles in pig iron prices in 1875. He found that highs of cycles followed 8-9-10 pattern and lows followed 16-18-20 pattern. A J Frost applied this cycle to Dow Jones to predict the next 10 years quite successfully in 1965. The book, Elliott Wave Principle, stops with projecting Benner’s cycle upto 1987.
We tried to project it further and found that the 2000-peak and 2010-peak were identified by this cycle but the 2008 decline was not captured properly. The next peak, according to this cycle, is 2018 that could be followed by a multi-year down-trend.
Another method employs Fibonacci ratios. This is done by multiplying the number of sessions that a move has consumed by the different ratios — 0.236, 0.382, 0.618, 1 and 1.618 and adding it to the ending point of the move to arrive at the time that the next up or down move can be spread over.
http://premium.thehindubusinessline.com/portfolio/big-story/the-fibonacci-mystique-in-markets/article9882845.ece

Rural electrification: With power coming to 84 pct of un-electrified villages in 2015


Rural electrification: With power coming to 84 pct of unelectrified villages in 2015, companies find a new market

On an overdrive with its Deen Dayal Upadhyaya Gram Jyoti Yojana (DDGJY), the government’s power shower could be dubbed as Saubhagya (good fortune) for a host of consumer durables and electronics makers.

Published: October 1, 2017 4:53 AM
Rural electrification, Deen Dayal Upadhyaya Gram Jyoti Yojana, rural electrification drive, DDGJY, electricity supply, electricity supply in India, durables market, power in villages, durable makers
Moinak Mitra
On an overdrive with its Deen Dayal Upadhyaya Gram Jyoti Yojana (DDGJY), the government’s power shower could be dubbed as Saubhagya (good fortune) for a host of consumer durables and electronics makers. In April 2015, the Centre’s rural electrification drive, DDGJY, identified 18,452 unelectrified villages countrywide, which is down by a whopping 83.4% today, at 3,046 villages — making targeted penetration to village households with power easier for consumer durable companies. Besides, the newly-minted Pradhan Mantri Sahaj Bijli Har Ghar Yojna (Saubhagya) scheme, which promises electricity to every household by 2018, will shed more light on profitability of consumer appliances makers down the line. Urban markets accounted for the major share (67%) of total revenues in the consumer durables sector in India in FY15, which sits at 60% today, say analysts. In rural markets, durables like single-door refrigerators and semi-automatic washing machines are likely to witness growing demand in the coming years as the government plans to invest significantly in rural electrification. The rural consumer durables market is growing at a CAGR of 25%.
Given the thrust on LED lights by the government for their energy efficiency and longevity, Bajaj Electricals rode the wave first. “We have an order book worth Rs 2,000 crore for LED lights as part of the electrification of villages drive in the states of Bihar, West Bengal and Karnataka,” says Shekhar Bajaj, CMD, Bajaj Electricals. While Bajaj’s light supply has a direct bearing with the electrification drive in villages, Anish De, partner and lead energy and infra advisory, KPMG, points out a big correlation between “reliable” power supply and demand for appliances. “Not only access, even the quality of power has improved over the last three years,” says De.
That reflects in the sales of Samsung India, which notches up 35% of its sales today from rural areas from just about 30% two years ago. “We were strongly focusing on rural markets Tier 2 onward and launched service vans to provide customer service to consumers across rural India last year,” says Rishi Suri, director, consumer electronics, Samsung India. With 3,000 service points across 6,000 talukas, Samsung’s rural reach is today the largest by any consumer durable company in the country.
Though Whirlpool of India refrained from divulging any numbers, managing director Sunil D’Souza agreed to the opportunity arising from rural electrification. “At Whirlpool, we are making sure we have the portfolio to appeal to first-time buyers, as also building our premium portfolio and expanding distribution and footprint on services to take advantage of this upcoming opportunity,” he said. For one, Anil Kumar Kadam, general manager for business development and solutions architecture at Schneider Electric, has been working on microgrids in the hinterland for long, and has seen first hand power as an enabler in rural areas.
“With sustained power in villages, we are seeing a sudden offtake in durables, which is led by states like Maharashtra, Uttar Pradesh and Tamil Nadu,” he says, adding how there has been a noticeable transformation as villagers are lapping up lighting gear, television panels, high-resolution DTH and
mobile phones. Kadam goes on to highlight how control farming is becoming staple after stable power flowing in to rural areas. “Control farming involves quite a few new technologies, such as using high voltage and high heat producing bulbs for livestock to grow faster.”
Today, even Panasonic India has found control in the hinterland with 40% of its customers coming from there, which stood at 30% two years ago. “Our growth in Tier 2 market onward has been significant as compared to Tier 1 over the last year… in 2016, we had 6,500 actively billing dealer points, which has increased to 9,100 August-end,” says Ajay Seth, head–sales and service, Panasonic India. Even Godrej Appliances, a Rs 2,750-crore flagship division of Godrej & Boyce, has seen the surge. “In appliances, our CAGR in rural areas is higher owing to high adoption, high per capita and electrification,” says Kamal Nandi, business head and  executive vice president of Godrej Appliances.
While it’s true that the definition of an electrified village under the DDGJY scheme hinges on a mere 10% of the households being electrified in the entire village, the shared optimism among the durable makers even before the Saubhagya comes into effect definitely signals the charge of the light brigade.
http://www.financialexpress.com/industry/rural-electrification-with-power-coming-to-84-pct-of-unelectrified-villages-in-2015-companies-find-a-new-market/877349/